Add Row
Add Element
cropper
update

[Company Name]

update
Add Element
  • Home
  • EYM Home
  • Categories
    • Website Optimization Tips
    • Smart SEO Insights
    • Content That Converts
    • Reputation Marketing Tips
    • Social Marketing Insights
    • Smart Lead Tactics
    • Video & Media Strategies
    • Success Tips
September 15.2025
1 Minute Read

SEO vs SEM: Which Strategy Will Skyrocket Your Website Fast?

Did you know 75% of users never scroll past the first search engine results page? Navigating the digital landscape can feel overwhelming, especially when it comes to deciding between SEO and SEM. Whether you’re a business owner wanting explosive growth or a curious marketer, decoding SEO vs SEM is the first step toward dominating the search engine market . Dive in to uncover proven tactics, the real impact of each strategy, and how one—or both—can propel your website to the top, fast.

Unlocking Growth: The Impact of SEO vs SEM on Your Search Engine Performance

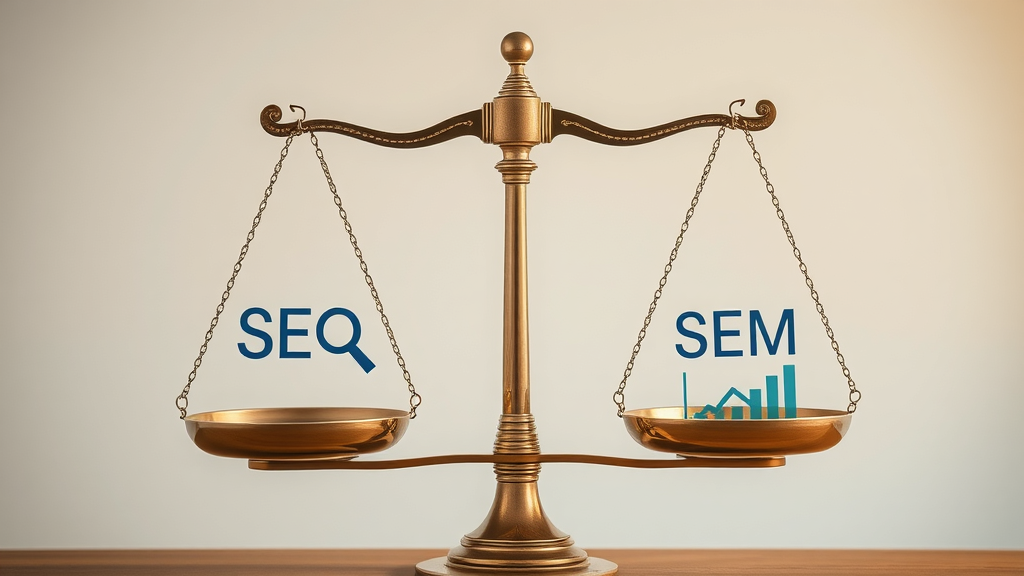
When seeking online success, understanding the impact of SEO vs SEM on your search engine performance is vital. Search engines like Google are the digital battleground for visibility, driving the lion’s share of web traffic. SEO (search engine optimization) focuses on earning higher positions in organic search results by improving website content, user experience, and site structure. On the other side, SEM (search engine marketing) incorporates both paid ads and SEO to boost immediate presence in the search engine market .

The main difference boils down to speed and sustainability. SEO nurtures long-term growth and credibility, but can take months or even longer before you see explosive results. In contrast, SEM —primarily powered by paid search methods such as Google Ads—delivers instant traction and swifter campaign data. To illustrate, startups might use SEM for instant leads while simultaneously investing in SEO for future gains. Understanding when to deploy each can shape your overall search engine marketing strategy and accelerate growth, both immediately and sustainably.

Dynamic business professionals analyzing website growth charts in a modern office with search marketing dashboards in the background, representing SEO vs SEM strategies.
  • In this guide, discover how SEO vs SEM shapes your approach to search marketing, when to use each strategy, and how the right tactics can accelerate your success in the search engine market.

What You'll Gain By Understanding SEO vs SEM

  • The key difference between SEO and SEM
  • How search engine marketing fuels rapid results
  • Step-by-step breakdowns of SEO and SEM components
  • Essential tools for keyword research and performance tracking
  • Strategies for integrating SEO and SEM for maximum ROI

Search Engine Basics: Foundation of Every SEO vs SEM Decision

How Search Engines Work and Influence the Engine Market

Search engines such as Google, Bing, and Yahoo are the gateways to the internet for most users. These platforms utilize complex algorithms and crawlers—or bots—that sift through billions of web pages each second. They evaluate everything from keyword relevance and page structure to backlink authority, assigning a rank score that ultimately determines where a site appears on the search engine results page .

This ability to organize, interpret, and deliver relevant content exerts a massive influence on the engine market . Commanding a top spot ensures higher organic traffic, credibility, and, often, better brand recognition. Understanding how search engines operate is the first step to mastering both SEO and SEM —giving you the foundation for any successful engine marketing initiative and making every optimization or ad dollar count in the competitive search engine marketing landscape.

Sophisticated server rooms and algorithm-driven search bots visualized, showing how search engines crawl the web in the engine market.

Organic Search vs Paid Search: Distinct Paths in the Search Engine Market

Organic search and paid search are the two primary avenues for visibility within the search engine market . Organic search relies on optimizing your site so it ranks naturally on results pages, without paying for placement. This depends on the strength of your site’s content, technical SEO, and authority-building through backlinks. Achieving top organic positions means capturing ongoing organic traffic and building trust—since many users value non-sponsored results more highly.

By contrast, paid search enables businesses to appear at the very top of search engine results through bids on specific keywords. Campaigns run via platforms like Google Ads let you instantly claim visibility—even for highly competitive keywords. This is invaluable for new products, seasonal sales, or when rapid traffic spikes are vital. The distinction shapes how you allocate budgets and expectations—organic methods require patience and consistent effort, whereas paid methods promise immediate but often short-lived results.

SEO vs SEM: Defining Each Strategy for Search Engine Dominance

What is SEO? A Deep Dive into Search Engine Optimization

SEO (Search Engine Optimization) is the practice of improving your website’s visibility in search engine results pages (SERPs) without paying for ads. The ultimate goal is to increase organic traffic by enhancing your site’s relevance and authority through on page seo, technical improvements, content creation, and link-building efforts. This means every tweak to content quality, metadata, navigation, and site speed can directly impact your exposure on search engines.

Effective SEO combines multiple disciplines—content strategy, technical site work, and ongoing keyword research—to help your pages rank higher for search queries relevant to your target audience. The benefits are enduring: increased trust, consistent traffic, and long-term growth. While SEO is often seen as a marathon, not a sprint, the compounding returns over time can make it one of the most cost-effective strategies in digital marketing.

Focused SEO strategist balancing website elements, mapping keywords and backlinks for search engine optimization.

What is SEM? Exploring the Engine Marketing Ecosystem

SEM (Search Engine Marketing) is an umbrella term that covers all tactics designed to gain visibility and drive traffic through search engines, including both SEO and paid search campaigns. In modern contexts, SEM commonly refers to paid methods—like Google Ads —but it’s important to remember that true SEM also values organic growth.

With SEM , advertisers can target specific keywords for instant placement on SERPs. Paid ads, shopping campaigns, retargeting, and display ads all fall under the SEM umbrella. Because SEM leverages bidding and campaign optimization, it’s uniquely positioned for product launches, promotional windows, and moments when reaching a specific target audience quickly is essential.

Key Difference Between SEO and SEM in Search Marketing

The key difference between SEO and SEM lies in their approach to visibility and speed of results. SEO is entirely focused on organic efforts aimed at earning a place in the unpaid portions of search engine results , building credibility over time. SEM encompasses both organic strategies and paid approaches, allowing businesses to appear immediately at the top of results pages through paid placements.

While SEO provides sustainable growth and high trust, SEM offers flexibility, immediate feedback, and scalable spending. The best strategy often blends both—using SEM for fast impact and SEO as the backbone for long-term dominance in the engine market and across major search engines .

Comparison Table: SEO vs SEM – Strategies, Timing, and Results
SEO (Search Engine Optimization) SEM (Search Engine Marketing)
Primary Focus Organic search results Organic search + Paid search
Timing Long-term, ongoing Immediate & short-term
Cost Structure Usually lower ongoing costs Pay-per-click (PPC), ongoing ad spend
Trust & Credibility High (organic results trusted by users) Variable (may be seen as "ads")
Use Case Brand-building, authority, sustained growth Product launches, promotions, fast results

Technical SEO Explained: Laying the Groundwork for Organic Search

On Page SEO: Optimizing Keywords and Content Quality

On page SEO is where your content meets technology for maximum search impact. This strategy involves optimizing title tags, meta descriptions, headers, and ensuring content answers users’ intent. Quality keyword research helps you pinpoint phrases your target audience is searching for, allowing for seamless integration into your content. Careful structuring, keyword placement, and internal linking also make it easier for search engines to crawl your website.

Beyond keywords, on page SEO means rigorous content audits, improving readability, optimizing images (with descriptive alt text for accessibility), and ensuring mobile friendliness. The better your on page SEO, the easier it is to earn prominent positions on the search engine results page —delivering users the best experience while satisfying search engine algorithms.

Detail-oriented marketer auditing website on laptop for on page SEO—analyzing keyword density and content structure.

Technical SEO: Improving Crawlability and User Experience

Technical SEO refers to backend optimizations that enhance your site’s infrastructure, making it easier for search engines to discover, index, and rank your content. Tasks like improving website speed, securing your site with HTTPS, creating XML sitemaps, optimizing robots.txt files, and ensuring mobile responsiveness are all key components. These technical refinements are essential—they support both organic search success and the overall usability of your site.

By focusing on technical seo , businesses boost website load times, decrease bounce rates, and ensure critical pages are properly indexed. These improvements are crucial for competing in the ever-evolving search engine market , as they influence both your site’s performance and its ranking on engine results pages . Investing in technical SEO is foundational, as even the best content can’t thrive without a technically sound website to support it.

Search Engine Marketing: SEM Power Tools for Rapid Visibility

How Google Ads and Paid Search Shape the Search Engine Market

Google Ads and other paid search platforms are at the heart of SEM. They allow marketers to bid on keywords and secure top positions on the search engine results page almost instantly. These ads appear above or beside organic listings, granting prompt exposure and supreme control over targeting. This precision is invaluable—whether you’re targeting a specific demographic, location, or device, paid ads let you adjust campaigns in real-time to maximize impact.

The value of Google Ads within the engine market is clear: new businesses can gain traction immediately, while established brands can strategically defend territory or boost campaign performance on demand. However, successes rely heavily on budget management, ad copy quality, and continual optimization. To truly master search engine marketing , understanding the nuances of paid platforms like Google Ads is essential for maneuvering both rapid results and measured growth.

Modern marketing team reviewing Google Ads campaigns and paid search analytics to shape the engine market.

Keyword Research Methods for SEM and SEO

Keyword research is the foundation of both SEM and SEO strategies. For SEO, it involves identifying the terms your target audience uses to find products, services, or information—then naturally incorporating these terms into your content and meta data. This kind of research includes assessing competition, analyzing search volume , and focusing on user intent. For SEM, keyword research is even more granular—ad groups, negative keywords, and bid strategies all hinge on accurate, data-driven keyword selection.

Popular tools for keyword research include SEMrush, Ahrefs, Google Keyword Planner, and Moz. Each tool helps uncover high-traffic phrases, analyze your competition, and fine-tune your campaigns based on live data. Regular keyword audits ensure your campaigns remain relevant and outperform your competitors on the search engine results pages . Successful search engine marketing combines robust research for both organic and paid channels, amplifying every campaign effort.

Expert digital marketer using keyword research software, exploring search trends and keyword clusters for SEM and SEO.

Crafting Compelling Ads: Maximizing ROI in Engine Marketing

Effective ads are at the heart of high-performing SEM campaigns. Crafting compelling ad copy requires clarity, relevance, and a powerful call-to-action tailored to your target audience . Strong campaign structure—using tightly focused ad groups and targeted landing pages—ensures higher quality scores and better ad placement on the results page . A/B testing headlines, using ad extensions, and focusing on benefits over features can all improve click-through and conversion rates.

To maximize ROI, it is vital to monitor real-time analytics—tweaking bids, refining targeting, and identifying what resonates with your audience. Success in search engine marketing depends on agility: the more you test and adapt, the more effectively you’ll outmaneuver the competition on the search engine results page and deliver measurable business impact.

SEO and SEM: Integrating Strategies for Search Marketing Success

When to Choose SEO, SEM, or Both in the Engine Market

Choosing between SEO, SEM, or a hybrid approach depends on your business goals, resources, and timeline. For industries with intense competition or businesses requiring immediate leads—like ecommerce, events, or new product launches—SEM provides vital fast-track access to your target audience . By contrast, organizations focused on brand trust and sustainable growth naturally lean into SEO, as long-term organic rankings consistently generate organic traffic without ongoing ad spend.

For most, an integrated approach offers the best of both worlds. Launch SEM for rapid results and data collection, then channel insights into SEO content and structural optimizations. Over time, you can transition budget from paid to organic as visibility and authority grow, leveraging both strategies for maximum presence in the search engine market .

Confident business strategist at a crossroads, evaluating decision paths for SEO and SEM in the search engine market.

Measuring and Combining Organic and Paid Search Results

Tracking the effectiveness of your SEO and SEM campaigns is crucial for ongoing improvement. Use analytics platforms to monitor organic and paid traffic, click-through rates, conversion rates, and ROI. Integrating data from Google Analytics, Search Console, and ad platform dashboards creates a unified view of performance across channels. This enables real-time adjustments and helps prioritize where future budget and resources should go.

Combining SEO and SEM unlocks greater insight—understanding which keywords perform best, how paid and organic listings complement each other, and which content resonates with your target audience . By tracking KPIs and running periodic audits, brands can continually refine their approach, optimize for greater visibility, and stay ahead in the search engine marketing game.

“Successful brands master the art of balancing SEO and SEM to create unstoppable search visibility.”

Watch: Businesses Succeeding with SEO, SEM, or Both

Case studies repeatedly show that companies blending SEO and SEM outperform those relying on a single approach. For example, a retail startup used Google Ads for instant traffic and sales during launch week, while concurrently improving on page SEO and building backlinks for future organic growth. Within six months, paid strategies ensured steady daily leads, while SEO efforts began driving an increasing share of conversions—resulting in a robust, multi-channel presence in the crowded search engine market .

Such examples illustrate the compounding effect of leveraging both strategies. The ability to experiment, gather data, and optimize across channels ensures consistent growth and agility in responding to changing online trends or algorithm updates. Video walk-throughs of such strategies can offer additional, practical insights for those looking to implement SEO and SEM in tandem.

List: SEO vs SEM – Pros and Cons in the Current Search Engine Market

Balanced set of traditional scales, one side with SEO icons, the other with SEM icons, symbolizing the pros and cons in the search engine market.
  • SEO Pros: Cost-effectiveness, Trust, Long-term Growth
  • SEO Cons: Slow Results, Algorithm Dependency
  • SEM Pros: Immediate Visibility, Precise Targeting
  • SEM Cons: Ongoing Costs, Ad Fatigue

What is the difference between SEO and SEM?

Answer: SEO optimizes your site for organic search while SEM includes both organic optimization and paid search tactics for maximum visibility.

What is the difference between paid SEO and SEM?

Answer: Paid SEO refers to paying for optimization services or tools, whereas SEM predominantly focuses on paid ads in addition to organic efforts.

What are the benefits of SEM over SEO?

Answer: SEM provides instant visibility, scalable targeting, and data-driven insights ideal for launches or fast campaigns, outperforming SEO in short-term results.

Is Google Ads SEO or SEM?

Answer: Google Ads is a core component of SEM, not SEO; it allows marketers to instantly place ads on the search engine results page.

FAQs on SEO vs SEM in Search Engine Marketing

Curious business owner consulting with digital marketing expert, discussing FAQs on SEO vs SEM in search engine marketing.
  • Can small businesses benefit from using SEO and SEM together? Absolutely! Small businesses can use SEM for quick visibility while building authority with SEO—delivering both short-term results and sustained growth.
  • How often should keyword research be updated in search engine marketing? Ideally, keyword research should be reviewed quarterly or whenever major shifts in the industry or your offerings occur, keeping campaigns fresh and relevant.
  • Do search engines rank sites higher for using both SEO and SEM? No, search engines don’t give higher organic rankings for running ads, but combining both can increase your brand’s overall visibility on the results pages.
  • Is on page SEO enough or should technical SEO always be included? Technical SEO should always complement on page SEO, ensuring your website is accessible, fast, and optimized for both users and search engines.

Watch: Actionable Tips for Boosting Your Engine Market Performance

Knowledgeable presenter summarizing SEO and SEM strategies with actionable tips for boosting performance in the search engine market.

Expert Insights: How to Choose the Right Search Engine Strategy for Your Business

“Adaptability is key—align your strategy with your goals, market, and resources for optimal results in the engine marketing world.”

Integrating SEO and SEM for Maximum Search Engine Impact

  • Combining keyword research across platforms
  • Balancing organic and paid campaign budgets
  • Tracking KPIs for ongoing improvement

Summary: Find Your Edge in the Search Engine Market

Winning in the search engine market often requires both patience and agility. Blending SEO for credibility and SEM for speed gives you a competitive advantage in an ever-evolving digital landscape. Analyze, adapt, and never stop optimizing.

Take the Next Step: Transform Your Approach with SEO vs SEM

  • Ready to unlock your website’s true potential? Harness the power of both SEO and SEM to dominate the search engine market today.

Understanding the distinctions between SEO and SEM is crucial for developing an effective digital marketing strategy. SEO (Search Engine Optimization) focuses on enhancing a website’s visibility in organic search results through content optimization, technical improvements, and link-building efforts. This approach aims for long-term growth and credibility but typically requires several months to yield significant results. In contrast, SEM (Search Engine Marketing) encompasses both SEO and paid advertising strategies, such as pay-per-click (PPC) campaigns, to achieve immediate visibility in search engine results. While SEM can drive quick traffic, it involves ongoing costs and may not offer the same level of trust as organic results. Combining both strategies can provide a balanced approach, leveraging the immediate benefits of SEM while building sustainable growth through SEO.

For a comprehensive understanding of these strategies, consider exploring the following resources:

  • SEO Vs SEM: What’s the Difference?

  • SEO vs. SEM: What’s the difference?

These articles provide in-depth insights into the differences between SEO and SEM, helping you determine the best approach for your website’s growth.

Smart SEO Insights

Write A Comment

*
*
Related Posts All Posts
12.12.2025

Creating a Marketing Dashboard in Google Looker Studio Fast

Did you know that marketers using real-time dashboards are 28% more likely to report success in meeting their marketing goals? If you’re still switching between Google Ads reports, Google Analytics, and social media tabs—there’s a faster, more actionable method. Creating a marketing dashboard in Google Looker Studio doesn’t just save time; it puts insights and next actions at your fingertips. Ready to unlock rapid, data-driven decision-making? Let’s get started with a guide designed to turn your digital marketing data into results—fast. Unveiling the Power: Why Creating a Marketing Dashboard in Google Looker Studio Changes Marketing Performance Creating a marketing dashboard in Google Looker Studio fundamentally transforms how teams view marketing performance . Instead of being bogged down in spreadsheets or toggling between Google Ads, Analytics, and Facebook Ads, Looker Studio unifies everything in a single interactive dashboard. By leveraging this powerful tool, marketers gain immediate access to key metrics like campaign performance, top traffic sources, and ROI calculations in real-time. This immediate feedback loop enables faster, better-informed decisions—no more waiting for monthly or even weekly reports to act on trends. What further sets Looker Studio apart is its ability to connect multiple data sources seamlessly. Whether your focus is digital marketing, organic search, or paid campaigns, you can combine Google Analytics data, social media metrics, and more. This centralization of information ensures that your team makes decisions with the most holistic perspective possible, enhancing collaboration and campaign optimization. Let’s not forget the data visualization advantage. Using everything from bar charts and pie charts to advanced filters and drill-down views, Looker Studio dashboards make it easy to spot opportunities and threats at a glance. For marketing teams under pressure to deliver quick wins or fix bottlenecks, real-time insights are the difference between proactive leadership and reactive scrambling. Step-by-step guide for creating a marketing dashboard in Google Looker Studio Key data sources: Google Ads, Google Analytics, social media platforms Best practices in data visualization and marketing dashboard structuring How to measure, present, and act on marketing analytics data Getting Started with Creating a Marketing Dashboard in Google Looker Studio Starting with Google Looker Studio might feel overwhelming, but the setup process is user-friendly. Before you dive into creating widgets or visualizations, create a free Google account if you don’t already have one. Visit the Looker Studio homepage, and follow the prompts to complete your initial profile configuration. After logging in, you’ll find options to create a new report—your first blank marketing dashboard. This is where your journey begins. At this stage, taking the time to define your marketing goals and the key metrics you want to track will set you up for dashboard success. Think about your most critical data sources—Google Ads for PPC performance, Google Analytics for website behavior, and platforms like Facebook Ads or YouTube Analytics for campaign tracking. Later in this guide, you’ll connect multiple data sources and customize your dashboard for your unique marketing needs. Creating an Account and Initial Setup in Google Looker Studio To begin crafting your marketing dashboard , start by navigating to Looker Studio and signing in with your Google account. The platform guides you through setting up your workspace, including linking any Studio Pro accounts if you’re aiming for enterprise features. The interface is clean and intuitive. Start a blank report or select a template to streamline your setup process. Naming your dashboard and organizing it in folders keeps things tidy, especially if collaborating with a broader digital marketing team. Once inside, you’ll be prompted to choose from premade templates or begin with a fresh, empty canvas. While templates are helpful for beginners, starting blank allows full control over data sources and design. No matter which route you choose, secure your work by leveraging Google Drive integration for instant cloud backups and easy sharing with stakeholders. Connecting Your Key Data Sources: Google Ads, Google Analytics, and More Central to any marketing dashboard is its connection to the most important data sources. Looker Studio offers direct connectors for Google products like Google Ads and Google Analytics, as well as third-party connectors for Facebook Ads, YouTube Analytics, and more. To link your data: Click “Add Data” on your Looker Studio dashboard (or during setup). Choose your data source—such as Google Ads, Google Analytics, or a third-party social media connector. Authenticate your account when prompted, select the view or account to pull data from, and confirm. Repeat for each marketing channel to consolidate insights from every campaign. The ability to connect multiple data sources is a standout feature, enabling you to blend paid, organic, and social data for a holistic analysis. This not only supercharges your reporting, but empowers efficient, cross-channel marketing efforts . Google Ads Google Analytics Social Media Platforms Facebook Ads YouTube Analytics Step Guide: Designing Your First Marketing Dashboard in Looker Studio Building an effective marketing dashboard in Google Looker Studio starts with a clear understanding of your reporting needs and end-users. The step guide below will walk you through critical design phases: selecting templates, adding essential widgets, and laying the foundation for deeper marketing analysis. You’ll learn not just how to build, but how to create a dashboard that accelerates decision-making and actionable insight delivery. Whether you work solo or in a team, these steps are adaptable and scalable, fitting both simple and complex data studio dashboards. Remember, a well-structured dashboard should communicate the full scope of your marketing data and campaign performance at a glance, eliminate data silos, and allow anyone from executives to analysts to make informed business decisions. Choosing the Right Template or Starting From Scratch When designing your first looker studio dashboard , you have two main choices: use one of Looker Studio’s pre-built templates or start from scratch with a blank report. Templates help accelerate your setup, providing preconfigured widgets for Google Ads, Analytics, and basic social media reporting. However, these templates may crowd you with unnecessary charts or irrelevant metrics. Starting with a blank report offers full creative and analytical control. Ask yourself: What are your campaign goals? Who are your dashboard stakeholders—sales, marketing, or executives? Choose only the most relevant metrics for those audiences to avoid dashboard clutter. Use a logical structure, grouping KPIs (key metrics) by channel or campaign, and apply the same naming conventions for consistent tracking. Adding Data Visualizations: Core Widgets and Charts for Google Data Studio Dashboards Data visualization is at the heart of actionable reporting. Google Looker Studio supports a range of chart types—bar charts, line graphs, pie charts, and heatmaps—that translate raw data into easy-to-scan insights. To ensure clarity, match visualization types to the nature of your data: use bar charts for campaign performance comparisons, line graphs for trend analysis over time, and pie charts for audience segmentation or traffic sources. Each widget in your marketing dashboard should answer a specific business question clearly and concisely. You can enrich your dashboard further by leveraging advanced widgets, such as scorecards for KPIs, tables for detailed breakdowns, and even “blended data” views to combine metrics from different data sources. Using interactive filter controls helps users drill down into data by time period, campaign, or channel. Focus on clarity—avoid overloading your dashboard with too many visualizations or colors, as simplicity speeds up interpretation, especially for non-technical stakeholders. Customizing Branding, Layout, and User Access for Google Marketing Dashboards A standout marketing dashboard isn’t just about the data—it’s about communicating your brand’s identity and facilitating effortless navigation. You can upload your company logo, use brand colors in charts and accent elements, and design layouts with white space for readability. Arrange widgets by importance: place core metrics—like conversions, spend, and ROAS—at the top, while supporting details can be further down or tabbed. User access management is equally vital. With Google Looker Studio’s robust sharing and permissions controls, you decide who sees what. Grant view-only permissions for stakeholders and editing rights for collaborators. Scheduling automated email reports directly from your Looker Studio dashboard ensures decision-makers receive updates on time, without extra work from your team. Comparing Chart Types and Data Visualization Methods For Marketing Metrics Chart Type When to Use Best for Bar Chart Comparing discrete values across campaigns Channel performance, campaign comparisons Line Graph Showing trends over time Website traffic, ad spend across months Pie Chart Visualizing proportions in a whole Traffic source breakdowns, device splits Scorecard Highlighting single metrics Key KPIs, conversions, cost Heatmap Identifying patterns and anomalies Engagement by hour/day, top content Automating KPIs: Tracking and Presenting Key Marketing Metrics in Google Looker Studio With your dashboard structure in place, the next step is automating the tracking of critical KPIs . Automation in Looker Studio eliminates manual reporting and ensures your dashboard always reflects the freshest data from connected data sources like Google Ads, Analytics, and social media platforms. By setting up automated data refreshes and scheduled reports, your marketing team receives real-time insight and can quickly pivot campaigns as needed. When presenting metrics, use a mix of dynamic widgets (like scorecards and bar charts) that update in real-time. Add context by displaying historical performance alongside current figures, helping your team identify trends, benchmark goals, and act proactively. Defining and Selecting Critical Marketing KPIs KPIs (Key Performance Indicators) are more than numbers; they’re the heartbeats of your marketing dashboard . Typical KPIs tracked in Looker Studio include conversion rates, cost per acquisition, ROI, click-through rates, and social engagement. The golden rule is to select KPIs aligned with your campaign objectives. For brand awareness, track impressions and reach. For conversions, focus on leads, sales, or app installs. For paid traffic efficiency, monitor cost per click (CPC) and ROAS. Avoid the temptation to track every available metric from your data sources. Instead, spotlight the KPIs that directly impact business outcomes. Grouping these in a prominent dashboard section ensures your marketing team—and decision-makers—spend their energy interpreting what matters most. Setting Up Automated Reporting and Alerts for Ongoing Campaign Optimization One of the most impactful features of Google Looker Studio is automation. Set up scheduled dashboard email reports so stakeholders are updated at regular intervals—weekly, monthly, or after campaign launches. Go even further by using data source connectors or third-party add-ons that trigger alerts when certain KPIs cross thresholds, for example, when ad spend surpasses a set budget or conversion rates drop below target. This automation frees your team from manual data pulls, reduces reporting errors, and ensures that intervention is never delayed. Use these alerts and scheduled reports to transform your data analysis from reactive to proactive—fixing issues before they escalate and capitalizing on campaign wins in real time. “Dashboards empower marketers by transforming complex data into clear, actionable insights.” Integrating Social Media and Facebook Ads into Your Marketing Dashboard Most marketing strategies today span multiple platforms, with social media and Facebook Ads playing a key role. Google Looker Studio makes integrating these data sources straightforward—allowing your reporting to span all digital touchpoints, from organic social reach to paid ad performance. By blending Facebook Ad data with Google Analytics or Google Ads, you gain a 360-degree view of channel synergy, attribution, and audience overlap. Beyond just monitoring likes and shares, your dashboard can surface deeper insights like ROAS from Facebook Ads, engagement rates from Instagram, or even YouTube channel growth—all in one unified location. This omnichannel reporting is essential for aligning your messaging and budget allocation. Connecting Social Media Data Sources to Looker Studio To add social and Facebook Ad data, use the available data connectors (either built into Looker Studio or through trusted third-party providers). These connectors allow you to sync data from sources like Facebook, Instagram, LinkedIn, and YouTube. Select “Add Data” in your dashboard, choose the relevant connector, authenticate your account, and select the advertising or post-level metrics to import. Once imported, blend these sources with traditional website analytics or Google Ads for an accurate, actionable look at your total digital marketing performance. The goal: replace siloed spreadsheets with interconnected, smart marketing dashboards. Visualizing Facebook Ads & Social Media Metrics in Google Data Studio With social and Facebook Ads data integrated, you can now customize visualizations specifically for these channels. Use bar charts to compare campaign spend and reach, pie charts to show audience or device splits, and line graphs to monitor engagement trends over time. Setting up scorecards for metrics like cost per click, conversion rate, or total leads gives an instant, at-a-glance health check for each platform. These visualizations enable quick, comparative analysis, helping marketers confidently allocate budgets to best-performing channels. If you’re handling multiple brands or regions, apply filters to view data by segment—making your Facebook Ads and social media reporting as granular or as high-level as needed. Advanced Features: Filters, Segmentation, and Custom Calculated Fields in Looker Studio Advanced dashboard features in Google Looker Studio empower you to extract even richer, more actionable marketing insights. Filters and segmentation tools allow users to slice the data by time period, campaign type, audience, or region, providing context for every metric on display. With custom calculated fields, you can build unique KPIs—like customer lifetime value, engagement rate per post, or blended ROAS—that standard tools may not offer natively. As your digital campaigns evolve, these advanced features ensure your marketing dashboard remains adaptable and relevant. You’ll be ready to answer increasingly complex business questions with clear, instantly accessible data. Leveraging Filters and Segments for Deeper Marketing Analysis Filters let users interactively slice dashboard data, zooming in on key metrics for specific campaigns, products, or touchpoints. Segmentation goes further by grouping audiences—for example, examining new vs. returning visitors, organic search vs. paid traffic, or mobile vs. desktop performance. In Looker Studio Dashboards, this approach accelerates root-cause analysis, helping teams make informed campaign adjustments in minutes rather than days. Using filters also enhances dashboard usability. Instead of static reports, your users can analyze what matters most to them, making the dashboard a living tool rather than a monthly artifact. Test your filter settings with stakeholders to ensure they function logically and return the expected data views. Using Custom Calculated Fields for Unique Marketing Metrics Calculated fields supercharge your marketing analysis by enabling you to derive new insights from existing data. Want to track “blended cost per lead” across Google Ads, Facebook Ads, and organic channels? Simply create a formula that combines these data sources into a single metric. You can also construct advanced calculations for things like weighted conversion rates, cumulative ROI, or dynamic scoring models. This flexibility lets you go far beyond the default metrics offered by your connected platforms. Use calculated fields to craft metrics tailored to your business questions, ensuring your marketing dashboards provide a strategic advantage. Collaboration and Publishing: Sharing Your Google Looker Studio Marketing Dashboards Securely Your marketing dashboard is only as powerful as your ability to share its insights. Google Looker Studio makes collaboration seamless with multiple sharing options, from direct Google Drive access to emailed dashboard reports. Secure permissions ensure each stakeholder sees only the relevant data—whether they’re senior leadership, marketing analysts, or partner agencies. With Looker Studio’s cloud-based architecture, everyone stays synchronized with the latest updates and revisions without version control headaches. Make use of scheduled automated email dispatches, embedding dashboards in websites, or generating shareable links for both internal and external partners. Advanced permission settings let you control who can view, edit, or reshare reports, preserving data confidentiality without reducing accessibility. Best Practices for Sharing, Permissions, and Scheduled Email Reports For efficient and secure dashboard sharing: Set clear permission levels : Assign “view only,” “edit,” or “owner” access based on user roles to prevent accidental changes or data leaks. Schedule regular report emails : Automate distribution of key insights to stakeholders at consistent intervals (e.g., every Monday morning), ensuring everyone operates from the same data. Audit sharing settings regularly : Especially important for new team members or when launching new campaigns, to guarantee only authorized users have ongoing access. Common Pitfalls to Avoid When Creating a Marketing Dashboard in Google Looker Studio Even the most powerful marketing dashboards can fall short if not structured thoughtfully. Avoiding common mistakes will ensure your data studio dashboard delivers clear, actionable insights without overwhelming users. The four top pitfalls to watch: Overloading dashboards with data – Too many widgets or metrics slow understanding and dilute actionable findings. Neglecting mobile responsiveness – Many stakeholders will view dashboards on tablets or phones; always test layouts for multi-device usability. Ignoring stakeholder needs – Involve end-users in dashboard design to align metrics with business objectives and decision-making processes. Failing to automate data sources – Manual data entries introduce errors and delay reporting. Automate connections wherever possible. By proactively addressing these challenges, you elevate your Looker Studio dashboard from a static report to a dynamic, decision-driving resource. Measuring Success: Interpreting Insights and Actioning Your Marketing Dashboards The ultimate value of creating a marketing dashboard in Google Looker Studio is not just in viewing metrics, but in turning them into strategic, data-driven actions. Successful interpretation requires setting clear benchmarks, regularly reviewing trends, and using dashboard insights to prioritize high-impact opportunities. Encourage your team to approach the dashboard not as a rear-view mirror but as a GPS—guiding optimizations, highlighting bottlenecks, and flagging emerging trends. Through continuous monitoring and rapid iteration based on Looker Studio data, you’ll turn insights into real marketing wins. Turning Data into Action: Prioritizing Insights from Google Data Studio Empower your team to start each week by reviewing dashboard insights, flagging outliers, and brainstorming responses. Prioritize quick wins—like reallocating budget to high-performing campaigns or troubleshooting dips in website traffic. Use annotations or comments directly in the dashboard to track follow-ups and accountability. Over time, this discipline transforms your dashboards into living, breathing engines for marketing acceleration and constant improvement. Expert Tips for Mastery of Creating a Marketing Dashboard in Google Looker Studio Standardize naming conventions for consistency across metrics and widgets. Use blend data to gain omnichannel marketing insights. Test all dashboard filters for accuracy and usability before stakeholder launch. Regularly audit your dashboard utility —remove outdated or unused charts. Invest in ongoing Looker Studio learning to stay current with platform updates and best practices. Frequently Asked Questions About Creating a Marketing Dashboard in Google Looker Studio How to create a dashboard in Google Data Studio? Start by creating a report in Looker Studio (formerly Google Data Studio). Connect your desired data sources (like Google Analytics or Google Ads), then drag and drop widgets (charts, tables, scorecards) to visualize metrics. Customize the design, add branding, and share with stakeholders using Looker Studio’s sharing and permission controls. How to create a marketing dashboard? Define your marketing goals, then select the most relevant KPIs for your business (conversions, CPC, engagement, etc.). Use Looker Studio to connect these data sources and choose visualization widgets. Arrange widgets logically—grouped by channel, time period, or funnel stage—to enable easy interpretation and fast decision-making. How do you create a dashboard in Looker? In Looker Studio, click “Create” and select “Report.” Choose your data source(s), add theme and layout, then build your dashboard by inserting charts, tables, and filters. Use calculated fields for custom KPIs and leverage scheduled emails to automate report distribution to your marketing team or stakeholders. What is the difference between Looker Studio and Looker dashboard? Looker Studio (formerly Data Studio) is a free tool for marketing data visualization and reporting, designed primarily for visual dashboards and automated reports. Looker (from Google Cloud) is a robust business intelligence platform supporting data modeling, in-depth data analysis, and scalable enterprise solutions. Choose Looker Studio for marketing dashboards; opt for Looker for advanced, organization-wide analytics projects. Summary and Next Steps for Creating a Marketing Dashboard in Google Looker Studio Now that you know how to build, automate, and optimize a marketing dashboard in Google Looker Studio , put your knowledge into practice. Start connecting your key data sources, design your first dashboard, and evolve it as your campaigns—and skills—grow. To enhance your understanding of creating a marketing dashboard in Google Looker Studio, consider exploring the following resources: “Create Impactful Marketing Dashboards with Looker Studio: Expert Tips from Loves Data” : This article provides expert insights into building effective marketing dashboards, covering essential steps such as defining objectives, connecting data sources, designing compelling visualizations, and ensuring interactivity. ( lovesdata.com ) “Looker Studio Tutorial: Automate Your Marketing Reporting” : This tutorial offers a comprehensive guide to automating marketing reporting using Looker Studio, including essential dashboard layout principles, adding interactive elements, and key metrics for marketing overviews. ( radyant.io ) These resources will provide you with detailed guidance and best practices to effectively create and optimize your marketing dashboards in Google Looker Studio.

12.10.2025

How to Analyze Customer Journey Data to Boost Conversions

Did you know: Companies that leverage customer journey analytics can improve conversion rates by up to 60% ? Understanding how to analyze customer journey data gives you the power to uncover hidden opportunities, improve customer experiences, and accelerate your revenue growth. This comprehensive guide will equip you with actionable insights and practical tools to map, assess, and optimize every step your customers take—from their first interaction to a lasting loyalty. Unveiling the Power of Customer Journey Analytics: Why Data-Driven Insights Matter In today's digital-first world, brands are built—or broken—on the experiences they deliver. Customer journey analytics is the process of tracking and analyzing how customers interact with your brand across various channels and touchpoints. By harnessing journey analytics tools, companies can develop a crystal-clear understanding of what motivates, excites, or deters their audience. When you analyze customer journey data, you discover not only where customers drop off but also where you excel, empowering better business decisions. Organizations integrating customer journey analysis into their workflows see significant benefits: increased customer satisfaction, higher engagement, and, most importantly, improved conversion rates. By turning raw data into actionable insights , leaders can proactively resolve pain points and personalize experiences. This marriage of analytics and empathy makes the difference between a generic customer interaction and a truly memorable journey. Did you know that companies leveraging customer journey analytics improve conversion rates by up to 60%? This guide breaks down how to analyze customer journey data—from first touch to final conversion—empowering you to make actionable, impactful decisions. Essential Takeaways: What You'll Learn in Mastering How to Analyze Customer Journey Data Discover how to map key touchpoints and apply journey analytics Uncover which data sources drive customer journey analysis Learn to select analytics tools that reveal actionable conversion insights See real-world examples and case studies of enhanced customer experience Foundations of Customer Journey Analysis: Key Definitions and Concepts Defining the Customer Journey: Mapping Stages from Awareness to Loyalty At its core, the customer journey is the full story of every customer’s experience with your brand. A customer journey map tracks how prospects move from initial awareness, through careful consideration, to purchase, and ultimately loyalty. Understanding these discrete stages is essential for identifying key interactions that shape decisions and drive brand relationships. Each customer journey begins at the awareness stage , where customers discover your brand through advertising, social media, or word-of-mouth. Moving forward, the consideration phase is where customers research and compare options. After a purchase, the journey extends to post-purchase engagement and the development of loyalty, where exceptional support and personalized experiences can transform one-time buyers into lifelong advocates. Effective journey mapping brings this entire customer lifecycle into focus, allowing you to make improvements at every stage. The Role of Customer Journey Analytics in Business Growth Customer journey analytics are a critical growth catalyst in the modern business landscape. By systematically analyzing customer data across all channels, you gain actionable insights into customer behavior and can anticipate what will drive higher customer engagement . This is key for turning touchpoints into conversion opportunities, minimizing pain points , and fostering enduring relationships. Brands that apply rigorous journey analysis can pinpoint bottlenecks and optimize the journey for business outcomes such as increased conversion rate, improved retention, and higher customer satisfaction. Analytics unlock hidden trends that would otherwise go unnoticed, empowering you to deliver relevant experiences and elevate your overall customer experience. "To understand the customer journey is to control your brand's future. Powerful analytics turn touchpoints into opportunities." How to Analyze Customer Journey Data: A Step-by-Step Approach Step 1: Collecting and Integrating Essential Customer Data Across Channels The first step in analyzing customer journey data is to gather information from every channel where customers interact with your brand—website visits, social media engagement, email opens, live chats, in-store interactions, and more. This comprehensive approach provides a unified view of the entire customer journey . To go beyond fragmented snapshots, integrate these diverse data sources into a central analytics tool or customer experience platform. This process, known as data integration , is vital for ensuring that you’re not missing any critical piece of the puzzle. This unified data then forms the basis for in-depth analysis, highlighting where prospects become customers and where experience gaps may exist. Step 2: Mapping the Complete Customer Journey and Its Touchpoints With your customer data in hand, the next step is to construct a customer journey map . This visualization lays out every key touchpoint—each time a customer interacts with your brand from the initial visit to post-purchase follow-up. Effective journey mapping helps clarify how customers flow through different channels and stages. Consider how prospects become aware, research options, compare, buy, and return for more. Identify pain points and high-value moments along this path. Mapping the customer journey not only uncovers friction but also reveals opportunities for improvement and personalization . Step 3: Leveraging Journey Analytics Tools for In-Depth Assessment Journey analytics tools such as Google Analytics, Adobe Analytics, Mixpanel, or dedicated customer journey analytics platforms are indispensable when analyzing customer journey data. These tools enable you to drill down into real-time metrics, track customer behavior across stages, and tie actions directly to specific outcomes like conversion or drop-off rates. By using these analytics tools, you can perform robust journey analysis, segment users by behavior or demographics, visualize pathing patterns, and compare different customer segments . The key is to blend quantitative data with qualitative feedback for a holistic view of customer experiences . "Analytics are only as strong as the data and strategy behind them." – Leading Data Expert Step 4: Segmenting Customers for Personalized Journey Mapping Not every customer follows the same path. Segmenting your customer base —by demographics, behavior, source channel, or purchase history—allows for more targeted journey mapping. This focused analysis shows how different groups travel unique routes and uncover distinct needs. Use your analytics tool to build these segments. For instance, new visitors may need more education, while loyal customers seek VIP perks. Tailor messaging and touchpoints to each segment for improved engagement and higher conversion rates throughout the customer life cycle. Step 5: Visualizing the Customer Journey with Advanced Journey Maps Visualization transforms complex data into actionable insights. Modern tools enable you to craft dynamic, interactive journey maps that show not just linear paths but also loops, branches, and skip points as customers interact across channels. These advanced journey maps provide clarity to teams across your organization—marketing, sales, product, and support—helping everyone understand where they can impact the journey. Visually rich maps reduce silos and foster collaboration, accelerating strategic improvements and delivering greater customer value. Step 6: Applying Customer Journey Analysis for Targeted Improvements Once your journey analysis is complete and pain points are visible, it’s time for action. Use your new insights to optimize high-impact touchpoints, reduce friction, and personalize offers for every segment. Track the impact of each change with real-time analytics. Continual improvement is key—test, learn, and iterate as you synchronize efforts across teams. This ongoing optimization, powered by customer journey analytics, leads to rising satisfaction and measurable boosts in conversion rate. Key Metrics and KPIs in Customer Journey Analysis for Conversion Optimization Customer engagement rate Touchpoint drop-off percentage Conversion event frequency Average time to conversion How to Track and Interpret Customer Behavior at Every Stage Successful analysis hinges on measuring what matters at each point in the customer journey. Track key performance indicators (KPIs) like engagement rate (interactions vs. impressions), drop-off percentages at each touchpoint, and conversion event frequency. These metrics reveal how customers navigate your journey maps and where improvement will have the biggest impact. Interpretation is just as important as data collection. Use benchmarks and historical trends to assess performance, and contextualize anomalies to uncover opportunities for optimization. With a detailed customer journey analysis, you can identify strengths, weaknesses, and drivers of customer engagement across their entire journey. Customer Journey Stage Key Metrics Analysis Goal Awareness Impressions, Clicks Identify acquisition strength Consideration Page Views, Engagement Uncover interest triggers Purchase Conversion Rate Optimize sales touchpoints Retention Repeat Purchases Foster loyalty drivers Using Customer Journey Analytics to Pinpoint Bottlenecks and Opportunities Leveraging journey analytics, brands can identify not only where customers engage or convert but also where friction emerges—moments that cause frustration or abandonment. Analyze drop-off points between stages, slow response times, and confusing workflows. Use customer segments to compare performance and inventory pain points. By regularly conducting this type of journey analysis , you’ll reveal opportunities for improvement that may have been invisible otherwise. Prioritizing these changes and monitoring their downstream impact will accelerate your path to higher conversion rates and stronger customer loyalty. "Journey analysis reveals invisible friction points that cost you conversions." Journey Mapping: Visualizing Data to Maximize Customer Experience Techniques for Building Actionable Customer Journey Maps To create journey maps that drive outcomes, start by gathering cross-functional teams—marketing, sales, product, and support. Use collaborative methods such as workshops, digital whiteboards, or sticky notes to document each step, challenge, and emotion a customer experiences. Supplement your qualitative mapping with quantitative analytics from your data. Add parameters such as frequency of touchpoint usage, dwell time, and drop-off probabilities. Integrating hard data with customer feedback ensures your journey maps remain grounded in reality, driving more precise improvements. Best Practices in Customer Journey Mapping with Real-World Examples Apply best practices such as focusing on high-impact touchpoints, integrating customer data for a unified view, and using journey maps as a living document for cross-departmental alignment. Real-life case studies show that organizations using data-driven journey mapping see not only improved customer experience but also faster time-to-market and better alignment on strategic goals. Identify and prioritize high-impact touchpoints Integrate customer data for a unified view Use journey maps to align cross-functional teams Advanced Customer Journey Analytics: Bringing AI & Big Data into the Fold How AI-Powered Analytics Tools Drive Predictive Customer Insights Now, artificial intelligence and machine learning revolutionize customer journey analysis . AI-powered analytics tools process massive amounts of real-time data, identifying patterns and predicting future customer behavior. These capabilities help forecast which actions will drive conversions and retention for specific customer segments. By layering predictive analytics on top of traditional journey mapping, businesses can proactively recommend the next best action, segment customers with pinpoint precision, and personalize experiences at scale. This transition from descriptive to predictive analytics propels your marketing and service into the future. Integrating Big Data for Enhanced Customer Experience Analysis Big data unlocks new potential for customer journey mapping . By aggregating diverse data streams—transaction histories, web analytics, customer support logs, and even social media—brands obtain a 360-degree view of customer interactions . Machine learning models highlight emerging trends and surface hidden opportunities for proactive engagement. Machine learning for trend identification Predictive analytics for proactive engagement Data-driven customer segmentation This comprehensive, data-driven approach allows you to personalize at every step, driving up loyalty and customer lifetime value while ensuring your efforts are always aimed at the most promising opportunities. From Data to Action: How to Improve Conversions with Customer Journey Analysis Optimize friction points Personalize experiences based on analytics Measure results and iterate strategies Make the leap from insight to action by focusing on the moments that influence customer outcomes. Use your findings to streamline the most problematic interactions, implement targeted personalization, and set clear KPIs to track results. Then, review your journey analysis regularly to adjust and refine your strategy, ensuring sustainable conversion growth. People Also Ask: Top Questions on How to Analyze Customer Journey Data What are the 5 E's of the Customer Journey? Engage, Educate, Excite, Experience, and Evangelize—these are the 5 E’s of the customer journey, capturing the core phases customers pass through when interacting with a brand. How can analytics be used in customer journey mapping? Analytics uncover trends, patterns, and drop-off points in customer journey mapping, enabling brands to optimize each touchpoint for improved experiences and conversions. What is KPI in customer journey? A KPI (Key Performance Indicator) in the customer journey measures success at critical stages, such as conversion rate, average order value, or engagement score. How to analyse customer service data? Analyze customer service data by monitoring response times, resolution rates, and satisfaction scores. Use journey analytics tools to correlate service interactions with journey stages. Expert Answers: Frequently Asked Questions on Customer Journey Data and Analytics What makes customer journey mapping essential for businesses today? Customer journey mapping provides holistic visibility into how customers interact with your brand, revealing friction points and areas for improvement. It guides targeted strategies for improving customer experiences and achieving better business outcomes. Which analytics tools best support journey analysis? Leading analytics tools include Google Analytics, Mixpanel, Adobe Analytics, and specialized customer journey analytics platforms like FullStory and Amplitude. These tools offer robust features for mapping, tracking, segmenting, and optimizing customer journeys. How do you align journey analytics with overall marketing strategy? Journey analytics inform marketing strategy by revealing which touchpoints and channels deliver the highest ROI. Integrate these insights into campaign planning, resource allocation, and personalization efforts for maximum impact. What are common pitfalls in customer journey analytics? Pitfalls include fragmented data sources, lack of cross-team collaboration, and over-reliance on quantitative data without customer feedback. Avoid these by fostering data integration, holistic strategy, and customer-centric thinking throughout the process. Practical Use Cases: Customer Journey Data Analysis in Action Retail: Increasing Online Sales with Journey Analytics A national online retailer mapped the entire customer journey across web, app, and social media, using journey analytics to identify high drop-off points at the product detail and cart stages. By A/B testing new product imagery and streamlining checkout flow, they improved their conversion rate by 18% over three months. This case demonstrates how combining real time analytics, customer behavior insights, and actionable changes creates measurable results in digital environments. B2B: Streamlining Complex Buying Journeys for Higher Conversions A leading SaaS provider used customer journey mapping to understand how leads moved from whitepaper download to closed deal. Pinpointing unused assets and underperforming email sequences helped the sales team focus on the most impactful touchpoints, shortening the sales cycle by 21%. Journey analysis illuminated the importance of coordinated, data-driven engagement across marketing and sales platforms—improving the customer experience for all stakeholders. SaaS: Using Customer Data to Drive Lifetime Value For one SaaS startup, segmenting customers by onboarding behavior revealed that users who completed certain training modules had a 2x higher retention rate. Personalizing the onboarding sequence boosted both immediate engagement and long-term loyalty, increasing customer lifetime value by 30%. This use of journey analytics underscores that targeted actions during critical moments pay powerful dividends across the entire customer journey . Key Resources: Tools, Templates, and Further Reading for Customer Journey Analysis Free journey mapping templates Top-rated journey analytics tools breakdown Additional guides and eBooks for in-depth learning Boost Your Conversions Now: Start Analyzing Your Customer Journey Data Today’s most successful companies don’t just collect data—they act on it. Begin your journey mapping and analysis now to outpace your competition, tailor experiences, and turn every touchpoint into a conversion opportunity. Start now: Choose your journey analytics tool, integrate your customer data, and map your customer journey for meaningful, actionable insight. To deepen your understanding of analyzing customer journey data, consider exploring the following resources: “How to Analyze (and Improve) Customer Journeys” by Twilio Segment offers a comprehensive guide on metrics and strategies for effective customer journey analysis. ( segment.com ) “How to Analyze the Customer Journey: Practical Techniques & Tools” by Userpilot provides actionable techniques and tools to enhance your customer journey analysis. ( userpilot.com ) These resources will equip you with practical methods and insights to optimize your customer journey analysis and boost conversions.

12.03.2025

How to Monitor Website Traffic Trends for Fast Growth

Did you know that 61% of marketers cite generating traffic and leads as their top challenge ? Learning how to monitor website traffic trends can be your secret weapon for outpacing competitors and achieving fast growth. Imagine what your website could achieve with real-time insights, data-driven strategies, and a process for acting quickly on user behavior trends. This guide will equip you with everything you need to become a master of site traffic analytics and accelerate your website’s climb to the top. "Did you know that 61% of marketers cite generating traffic and leads as their top challenge? Learning how to monitor website traffic trends can be your secret weapon for outpacing competitors and achieving fast growth." Understand the basics of how to monitor website traffic trends for fast growth Learn which analytic tools provide the best site traffic insights Discover how to interpret web traffic and user behavior metrics Identify strategies for acting on traffic data for exponential website traffic increases Unlocking the Power of How to Monitor Website Traffic Trends: Insights That Drive Rapid Growth The process of how to monitor website traffic trends is foundational if you want your site to thrive in the digital era. Monitoring isn’t just about numbers; it’s about unlocking insights that help propel you ahead of your competition. Whether you’re a website owner, marketer, or entrepreneur, understanding traffic patterns enables you to capitalize on what’s working and quickly pivot from what isn’t. For example, by tracking which blog posts spike after a social media promotion and analyzing user behavior, you can double down on content types that your audience craves. Imagine being able to spot a rising traffic curve after updating your blog’s SEO or seeing exactly which traffic sources deliver loyal, converting visitors. By regularly analyzing key web traffic analytics, you’ll know where your audience comes from, how they engage, and what prompts them to leave or stay. This intelligence fuels targeted marketing, smarter content, and fast business growth. Let’s dive in and see how this all comes together—because the secret to beating the competition starts with mastering your own data. How to Monitor Website Traffic Trends: Essential Concepts and Goals The importance of monitoring web traffic for website growth: Regularly tracking web traffic is not just for large enterprises—anyone with an online presence reaps benefits. Site traffic monitoring shines a light on user journeys from discovery to conversion. When monitored effectively, it can reveal critical insights like which pages need improvement, seasonal swings in engagement, and what drives or diminishes traffic. What are website traffic trends? Website traffic trends refer to patterns and changes in visitor activity over time. This includes rising or declining visitor counts, emerging sources of traffic data , shifts in popular content, and even technical glitches that could cause unexpected drops. Identifying and understanding these trends empowers you to make smarter marketing decisions and quickly adapt your strategies for sustained growth. Setting objectives for site traffic analysis: Before diving into website analytics dashboards, it’s crucial to determine your end goals. Are you aiming to increase your conversion rate , grow organic traffic, or reduce your bounce rate ? Setting clear objectives—like increasing newsletter sign-ups or boosting ecommerce product page visits—enables you to focus your traffic monitoring efforts and track progress with purpose. Key Metrics: What to Look For When You Monitor Website Traffic Trends Website traffic: sessions, users, and pageviews explained Understanding these basic web traffic metrics is essential. Sessions represent individual visits to your site, users are unique visitors, and pageviews show how many times pages were loaded. These metrics reflect your site’s reach and repeated engagement. For instance, if your sessions increase but unique users stay the same, you know your current audience is visiting more frequently, perhaps due to engaging content or an effective campaign. Bounce rate and user behavior signals to watch Bounce rate measures the percentage of visitors who leave your site after viewing only one page. A high bounce rate may signal poor user experience, irrelevant content, or slow site speed. Combining bounce rate with session duration and pages per session paints a detailed picture of your user behavior , helping you spot which landing pages require optimization and keep users exploring. Analyzing traffic data sources: organic, direct, referral, social Your traffic sources tell you where your website traffic is coming from. Organic refers to visitors from search engines, direct is from typed URLs or bookmarks, referral denotes links from other sites, and social comes from platforms like Facebook or LinkedIn. Tracking these sources helps you determine where your marketing and SEO efforts pay off most. Segmenting by device and location for deeper web traffic insights Modern traffic analytics lets you explore user segments, such as device type and geographic location. Are most of your users coming from mobile devices, or do you see a new surge in site traffic from a specific country? This information is golden for personalizing UX, optimizing your website for mobile, and targeting region-specific campaigns. Comprehensive Table: Key Web Traffic Metrics, Definition, and Why They Matter Metric Definition Why It Matters Sessions Individual visits to your site within a set time period Shows overall engagement and activity trends on your website Users Unique visitors (new or returning) to your site Helps gauge the size of your audience and reach Pageviews Total number of pages loaded across sessions Highlights popular content and site stickiness Bounce Rate Percentage of sessions with only one pageview Indicates relevance, page performance, and user experience issues Average Session Duration Mean time users spend on your site per session Measures how engaging your site and content are Traffic Source Origin where visitors are coming from (organic, direct, referral, social) Informs where your efforts succeed and where to focus more Pages per Session Average number of pages viewed per session Shows depth of engagement; higher values suggest more interest Conversion Rate Percentage of sessions that complete a goal (like signup or sale) Directly tied to business outcomes and ROI of web traffic Selecting the Best Tools to Monitor Website Traffic Trends Google Analytics: the gold standard for tracking website traffic Google Analytics offers comprehensive data on site traffic, user behavior, and conversion. The platform is free, easy to install, and integrates with most popular CMS solutions. With its wide array of reporting features, you’ll gain insights into traffic sources, landing pages, user demographics, and device segmentations—crucial for any website owner looking to make data-driven decisions. Using Search Console for search-specific web traffic data Google Search Console is essential if you want to monitor how your site performs in Google Search results. It reveals search queries, click-through rates, impressions, and technical issues that impact site visibility. Paired with Google Analytics, you get a full-spectrum view of how users find and interact with your pages. Comparing free web traffic checker tools Free options abound—from Google Analytics and Search Console to open-source traffic checker tools. While they might not have advanced competitor web analytics or deep historical reports, they’re perfect for monitoring day-to-day activity, site growth, and testing basic marketing strategies. Evaluating paid website traffic checker and traffic checker platforms For deeper insights, specialized platforms like SEMrush, Ahrefs, and Similarweb provide competitor web analytics, traffic estimate, keyword ranking analysis, and advanced reporting. These paid website traffic checker tool options are invaluable for benchmarking against the competition and uncovering new opportunities for traffic growth. Tip: Choose a mix of free web solutions for routine monitoring and invest in paid tools when your business or marketing strategy requires additional detail and competitor tracking. "Without actionable data from robust website traffic checkers, tracking website growth becomes guesswork." A Step-by-Step Guide: How to Monitor Website Traffic Trends Using Google Analytics Setting up Google Analytics on your website To start, sign up for a Google Analytics account and add the provided tracking code to your website’s code base or through your site builder. Once installed properly, Google Analytics starts collecting site traffic data, including user sessions, pageviews, and traffic sources. Make sure the code is added to every page to ensure accuracy. Navigating real-time and acquisition reports for site traffic Explore the Real-Time dashboard for instant traffic data—a great way to monitor campaign launches or content updates. The Acquisition section breaks down web traffic by source, letting you see if most of your visitors found you via organic search, social media, or referral links from other sites. Comparing this data week-on-week or month-on-month reveals site traffic growth patterns. Tracking user behavior with Google Analytics events and goals Use Events to monitor interactions like downloads, video views, or outbound link clicks. Goals help measure actions that impact business outcomes (newsletter signups, purchases, or contact form completions). This data is crucial for improving conversion rates and understanding what drives results. Creating custom dashboards for actionable web traffic analysis Custom dashboards in Google Analytics let you visualize only the data that matters most—such as top landing pages, conversion funnels, or traffic from specific campaigns. These dashboards streamline your workflow, making monitoring website traffic trends easy and insightful. Google Analytics Deep Dive Tutorial – An instructional video showing live monitoring of website traffic trends, dashboard navigation, and real-time report analysis. Leveraging Google Search Console and Other Search Console Tools for Traffic Data How to use Google Search Console to monitor website traffic trends After verifying your website with Google Search Console, you’ll gain insights into how your pages appear in search, keyword ranking, impressions, and clicks. Regularly inspect your traffic data within the Performance tab to see which search terms drive users to your site and which pages gain the most visibility. Identifying top-performing queries and landing pages Search Console lists the queries that bring users to your site, paired with data on your most popular landing pages. Use this information to optimize content around high-performing keywords and replicate success on other parts of your website. Fixing issues that impact site traffic and user behavior Search Console identifies technical SEO issues—such as crawl errors, broken links, or mobile usability problems—that can stunt web traffic growth. Fixing these promptly helps improve ranking, user experience, and traffic flow. Integrating Google Search Console data with Google Analytics By linking these accounts, you can analyze search performance alongside behavior metrics, getting a cohesive picture of the user journey from keyword to conversion. This integration is critical for website owners wanting to connect their SEO and marketing strategy with actual on-site engagement. Step-by-step video on leveraging Search Console to check traffic stats, interpret performance data, and fix web traffic issues. Interpreting User Behavior: Turning Web Traffic Metrics into Action What bounce rate reveals about your website Bounce rate is more than just a number—it’s a reflection of your website’s relevance, content quality, and UX. A high bounce rate on a popular page could signal a mismatch between expectation and delivery, or highlight issues with loading speed or confusing navigation. Understanding why visitors leave quickly allows you to make targeted improvements. Heatmaps, session recordings, and other user behavior analytics Tools like Hotjar offer priceless user behavior insights, combining click heatmaps and session recording. This data shows you exactly how users move, scroll, and interact with elements on your site. Spotting patterns—like frequent clicks on unlinked headers or ignored call-to-action buttons—helps you optimize content and site layout for increased engagement. Identifying drop-off points and optimization opportunities Analyze which steps in your conversion funnel lose the most visitors. Is a specific form too long? Are users abandoning carts on mobile devices? By identifying and removing these roadblocks, you not only improve overall web traffic but also conversion rates, leading to lasting website growth. Advanced Strategies: Competitor Web Traffic Analysis and Growth Moves Using competitor web traffic tools for benchmarking Platforms like SEMrush, Ahrefs, and Similarweb don’t just help you analyze your own data—they let you run competitor web traffic comparisons. Benchmark your site’s performance against leading competitors to identify where you’re excelling and where you have untapped potential. Uncovering and leveraging traffic opportunities missed by competitors Review the keywords, pages, and traffic sources that drive visits to competitor websites but are underutilized on yours. This competitive gap highlights golden opportunities for rapid growth, whether through new content, targeted outreach, or differentiating your value proposition. Adjusting your content and SEO strategy from traffic checker insights Use competitor web traffic analytics to refine your keyword targeting, increase content frequency around high-traffic topics, or build links from referral sites. Smart use of these insights lets you leapfrog the competition with focused marketing that resonates. Instructional video demonstrating how to benchmark web traffic using competitor checker tools and build growth strategies. People Also Ask – How to Monitor Website Traffic Trends for Fast Growth How can you monitor website traffic? Use web traffic checker platforms like Google Analytics and Search Console Set up tracking codes and analyze site traffic data regularly Monitor user behavior with heatmaps and event tracking How do I check website traffic stats? Log into your analytics dashboard (e.g., Google Analytics) Review metrics like sessions, pageviews, and bounce rate Use website traffic checker reports for daily, weekly, or monthly stats Which tool would you use to monitor website traffic trends? Google Analytics Google Search Console SEMrush, Ahrefs, Similarweb (for competitor web traffic) Specialized traffic checker solutions for advanced needs What is KPIs for website traffic? Sessions Users Bounce rate Average session duration Pages per session Conversion rate Best Practices and Quick Tips for Effective Traffic Data Monitoring Schedule regular web traffic reviews to catch trends or issues early and act before they impact your growth trajectory. Set alerts for unusual spikes/dips in site traffic to quickly investigate unexpected issues—or capitalize fast on viral opportunities. Track goals linked to business outcomes, not just visits —for example, focus on newsletter sign-ups, purchases, or contact inquiries, not just increasing pageviews. Leverage automation for reporting and actionable insights so key metrics are pushed to your inbox or dashboard without manual checks. "Measuring user behavior is the compass that guides your site to higher growth and conversion." Frequently Asked Questions – How to Monitor Website Traffic Trends Can I check web traffic for free? Yes, you can use free web traffic checker tools like Google Analytics and Google Search Console to track your traffic data, user behavior, and site performance without cost. These tools provide valuable, actionable insights suitable for businesses of all sizes. What is the best traffic checker for ecommerce sites? For ecommerce, Google Analytics (with Enhanced Ecommerce tracking) is outstanding. Combining it with platforms like SEMrush or Ahrefs allows you to check competitor web traffic and refine your marketing strategy for better targeting and conversion optimization. How often should I review website traffic trends? Ideally, monitor your website traffic data weekly for overall trends, but review daily during major campaigns or after implementing new strategies. Monthly, conduct deeper performance reviews to refine long-term growth plans. Are bounce rate and exit rate the same? No—bounce rate tracks single-page sessions, while exit rate shows the percentage of users who leave from a specific page, regardless of how many pages they’ve seen. Both are valuable user behavior metrics for optimizing site performance. Summary: Achieving Fast Growth by Mastering How to Monitor Website Traffic Trends Monitor site traffic by setting clear objectives and tracking core web traffic metrics using reliable website traffic checker tools Use actionable data from analytics platforms to refine your user experience, content strategy, and marketing campaigns Regularly analyze competitors and leverage unique opportunities to outpace rivals in site traffic and user engagement Continue learning by seeking out resources, tutorials, and new technologies to maintain your competitive edge Ready to accelerate your website's growth? Start implementing these techniques today and watch your website traffic soar! To effectively monitor website traffic trends and drive rapid growth, it’s essential to utilize robust analytics tools and understand key performance metrics. One invaluable resource is Google Analytics , a comprehensive web analytics service that tracks and reports website traffic, user behavior, and conversion rates. This platform offers insights into session duration, pages per session, and the engagement rate of visitors, enabling you to identify areas for improvement and optimize your site’s performance. Additionally, the article How to Check & Analyze Website Traffic provides a detailed overview of essential metrics such as page views, bounce rate, and traffic sources. Understanding these metrics allows you to assess your website’s performance, identify user behavior patterns, and make data-driven decisions to enhance user engagement and achieve your growth objectives. By leveraging these resources, you can gain a deeper understanding of your website’s traffic trends and implement strategies that foster rapid growth.

Terms of Service

Privacy Policy

Core Modal Title

Sorry, no results found

You Might Find These Articles Interesting

T
Please Check Your Email
We Will Be Following Up Shortly
*
*
*